
Introduction
In the realm of data management, where businesses and organizations grapple with vast troves of information, the ability to extract meaningful insights is paramount. Pivot tables, a cornerstone of MySQL’s data analysis capabilities, stand as a transformative tool, empowering users to distill raw data into a summarized and aggregated format, unveiling hidden patterns and trends that drive informed decision-making.
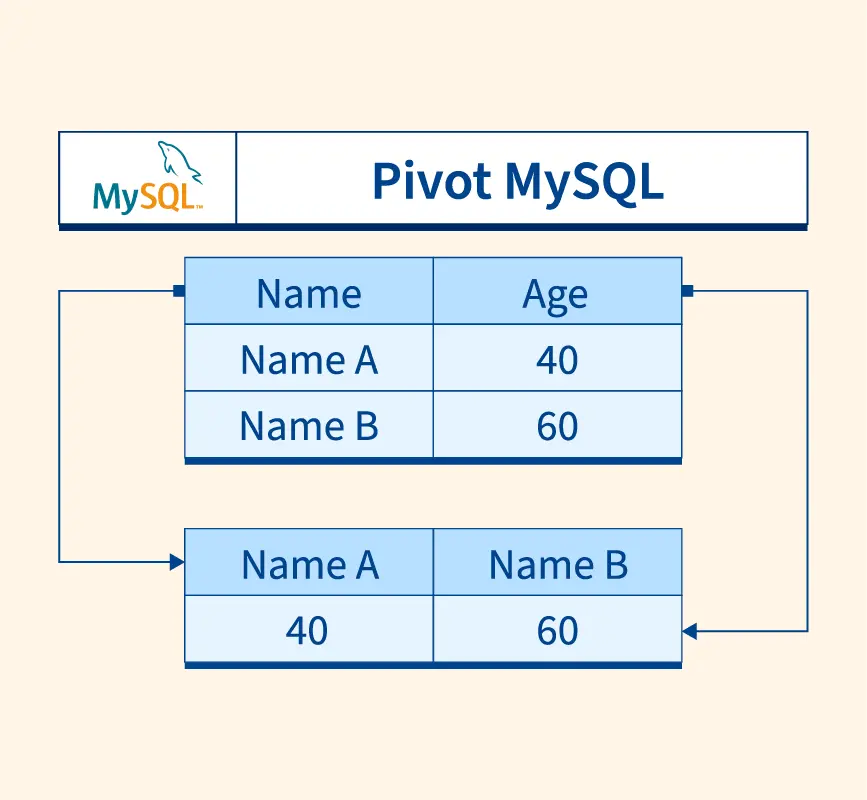
Harnessing the Power of Pivot Tables
Pivot tables transcend mere data manipulation; they embody a sophisticated approach to data exploration. By pivoting data around multiple dimensions, users can effortlessly gain a holistic understanding of complex datasets, identifying correlations, uncovering anomalies, and extracting actionable insights that fuel strategic growth.
Real-World Applications of Pivot Data
The transformative power of pivot data extends across diverse industries, enabling businesses to optimize operations, enhance customer experiences, and achieve strategic objectives. Let’s delve into three compelling examples:
Example 1: Retail Sales Analysis
Scenario: A retail manager seeks to analyze sales data across various product categories, regions, and time periods to identify top-selling items, optimize inventory management, and tailor marketing campaigns.
Query:
SQL
SELECT product_category, region, month, SUM(sales_amount) AS total_sales
FROM sales_data
GROUP BY product_category, region, month;
Result:
| Product Category | Region | Month | Total Sales |
|---|---|---|---|
| Apparel | North America | January | 10,000 |
| Apparel | North America | February | 12,000 |
| Apparel | North America | March | 15,000 |
| … | … | … | … |
Insights:
- Apparel emerges as the top-selling product category in North America across all months.
- Sales for Apparel in North America exhibit a steady upward trend from January to March.
Example 2: Website Traffic Analysis
Scenario: A website owner strives to understand user behavior, identify popular website sections, and optimize content based on visitor demographics and interests.
Query:
SQL
SELECT traffic_source, device_type, hour, COUNT(*) AS total_visits
FROM website_traffic
GROUP BY traffic_source, device_type, hour;
Result:
| Traffic Source | Device Type | Hour | Total Visits |
|---|---|---|---|
| Organic Search | Desktop | 10 | 200 |
| Organic Search | Mobile | 12 | 300 |
| Social Media | Desktop | 14 | 150 |
| … | … | … | … |
Insights:
- Organic search stands as the primary traffic source for both desktop and mobile devices.
- Website traffic peaks between 10 AM and 12 PM for both desktop and mobile users.
Example 3: Educational Performance Analysis
Scenario: An educator aims to evaluate student performance trends across different subjects, grade levels, and teaching methods to identify areas of strength and weakness, personalize instruction, and improve overall learning outcomes.
Query:
SQL
SELECT subject, grade_level, teaching_method, AVG(score) AS average_score
FROM student_scores
GROUP BY subject, grade_level, teaching_method;
Result:
| Subject | Grade Level | Teaching Method | Average Score |
|---|---|---|---|
| Math | 8th Grade | Lecture | 75 |
| Math | 8th Grade | Group Project | 82 |
| Science | 9th Grade | Lab Experiment | 88 |
| … | … | … | … |
Insights:
- Students in 9th-grade Science classes taught using lab experiments achieve the highest average score.
- Implementing group projects in 8th-grade Math classes can enhance student performance compared to traditional lectures.


Leave a Reply